title: "Marketing KPI design: why 5 metrics outperform 20 in EC operations" published: true description: "20 KPIs feel data-driven; 5 KPIs actually drive decisions. A revenue-first KPI framework for EC operators with priority by business phase, common pitfalls, and a quarterly review cadence." tags: marketing, ecommerce, analytics, kpi canonical_url: https://www.revenuescope.jp/en/news/marketing-kpi-design cover_image: https://dev-to-uploads.s3.amazonaws.com/uploads/articles/0zymcyhxlzju5psk41ap.png
The most common pattern I see at EC startups: weekly KPI reviews with 20-30 metrics, ending with no decision. MAU / WAU / DAU / PV / UU / new-rate / repeat-rate / bounce / dwell / scroll-depth / cart-add / drop-off — the longer the list, the harder it is to agree on what to push first. Ownership quietly evaporates.
I've fallen into this exact trap. The fix turned out to be embarrassingly simple: pick 5 KPIs, derived from the revenue formula itself, and treat everything else as supporting. Below is the short version of how I run that now.
TL;DR
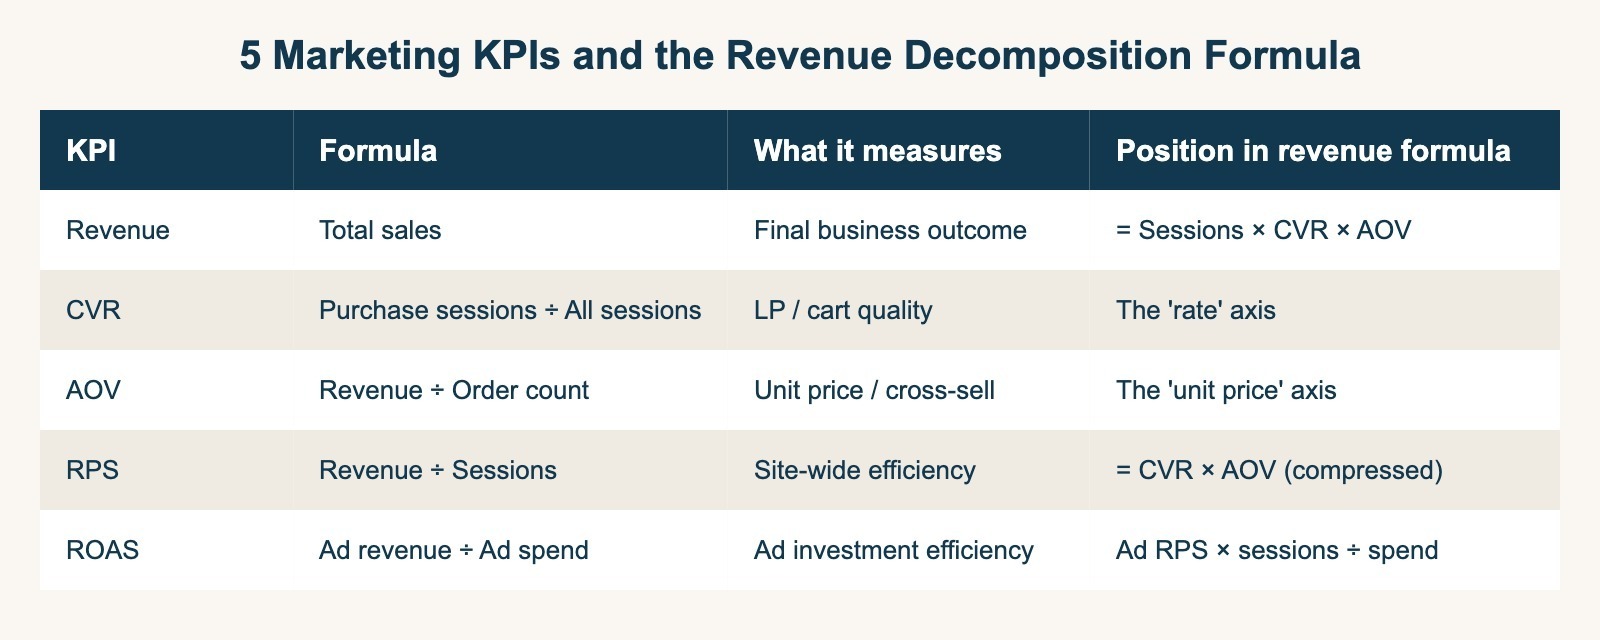
- 5 KPIs are enough — Revenue / CVR / AOV / RPS / ROAS. They aren't independent metrics. They're cross-sections of the same revenue formula
- Priority depends on business phase — Launch teams need sessions, growth teams need CVR, scale teams need ROAS / RPS, mature teams need AOV
- The biggest pitfall is not "too few KPIs" — it's the McNamara fallacy (overvaluing what's measurable, undervaluing what isn't)
- Split the 5 into "improvement" and "health" KPIs. Discuss improvement KPIs weekly. Discuss health KPIs only when they breach a threshold
The 5 KPIs every EC operator needs
The single equation that anchors KPI design:
Revenue = Sessions × CVR × AOV
Compress CVR × AOV into a per-session number, and you get RPS (Revenue Per Session):
Revenue = Sessions × RPS
ROAS is the same logic, scoped to ad-driven traffic only:
ROAS = Ad revenue / Ad spend
     = (Ad sessions × Ad-channel RPS) / Ad spend
These five — Revenue, CVR, AOV, RPS, ROAS — aren't independent KPIs. They are the same equation viewed from different axes. Every additional metric you might add (bounce rate, time-on-page, PV/session) is downstream of one of these axes, not a new dimension.
The thing that sold this framework for me: 5 KPIs aren't a "narrowing" of 20. They're the natural unit count of the revenue formula. You're not throwing away 15 metrics — you're noticing that 15 of the 20 were derivatives of the same 5 axes.
Why 5 is enough — the McNamara fallacy
The McNamara fallacy: overvaluing what is easily measurable and dismissing what isn't. Bounce rate is easy to pull from GA4. Revenue elasticity to LP design is hard. Guess which one ends up on the dashboard.
Three reasons 5 KPIs work:
- Coverage: Sessions / CVR / AOV / RPS / ROAS together cover who arrives, who buys, how much they buy, site efficiency, ad efficiency. Every legitimate question fits.
- Readability: With 5 metrics you can hold their interactions in your head. With 20, "tracking the correlation between metrics" becomes the job itself.
- Ownership: 5 metrics map cleanly to roles — CVR to LP team, AOV to merchandising, ROAS to paid media. With 20, no one owns the outcome.
Priority by business phase
Picking the one KPI to push depends on where the business is. The decomposition formula tells you immediately.
| Phase | Monthly revenue | Pain point | Top KPI |
|---|---|---|---|
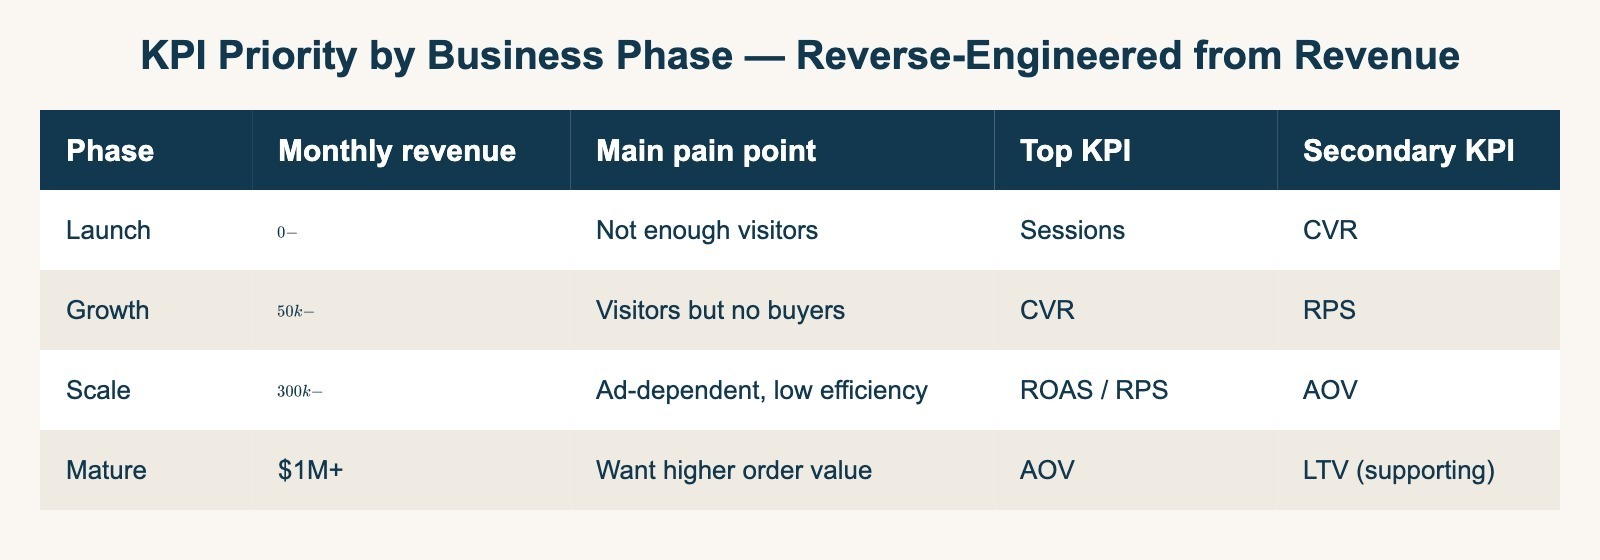
| Launch | $0 - $50k | Not enough visitors | Sessions |
| Growth | $50k - $300k | Visitors but no buyers | CVR |
| Scale | $300k - $1M | Ad-dependent | ROAS / RPS |
| Mature | $1M+ | Want higher unit price | AOV |
"Everything is important" is not a strategy. Picking the single KPI with the highest revenue elasticity for the current phase sets the priority for every meeting that quarter.
ROAS vs RPS — the most misused pair
The most common ad-budgeting mistake is using ROAS as the only signal. ROAS measures campaign-level ad efficiency (denominator: ad spend). RPS measures site-wide revenue efficiency (denominator: sessions). They answer different questions.
If your high-ROAS Meta campaign brings in visitors with a lower RPS than your organic search visitors, scaling that campaign drags down overall revenue efficiency. ROAS alone hides this. ROAS + RPS together tells you whether you're over-relying on paid traffic — a higher-order judgment call that only emerges when both are visible.
Four pitfalls I see repeatedly
- Too many KPIs, no decisions. Fix: 5 core metrics weekly, everything else demoted to monthly supporting tier.
- Measurable ≠ should-measure. Fix: for every candidate, ask "if this moves 0.1, how many dollars of revenue follow?" Vague answer → not a KPI.
- Different definitions across teams. Fix: a single 1-page KPI definition shared org-wide. New KPIs cannot be added without an entry.
- Last-click ROAS bias. Fix: use GA4 attribution or your own session log to calculate ROAS by channel with consistent attribution.
KPI weighting by business model
The 5 KPIs are universal. The weights are not.
| Business model | #1 | #2 | #3 |
|---|---|---|---|
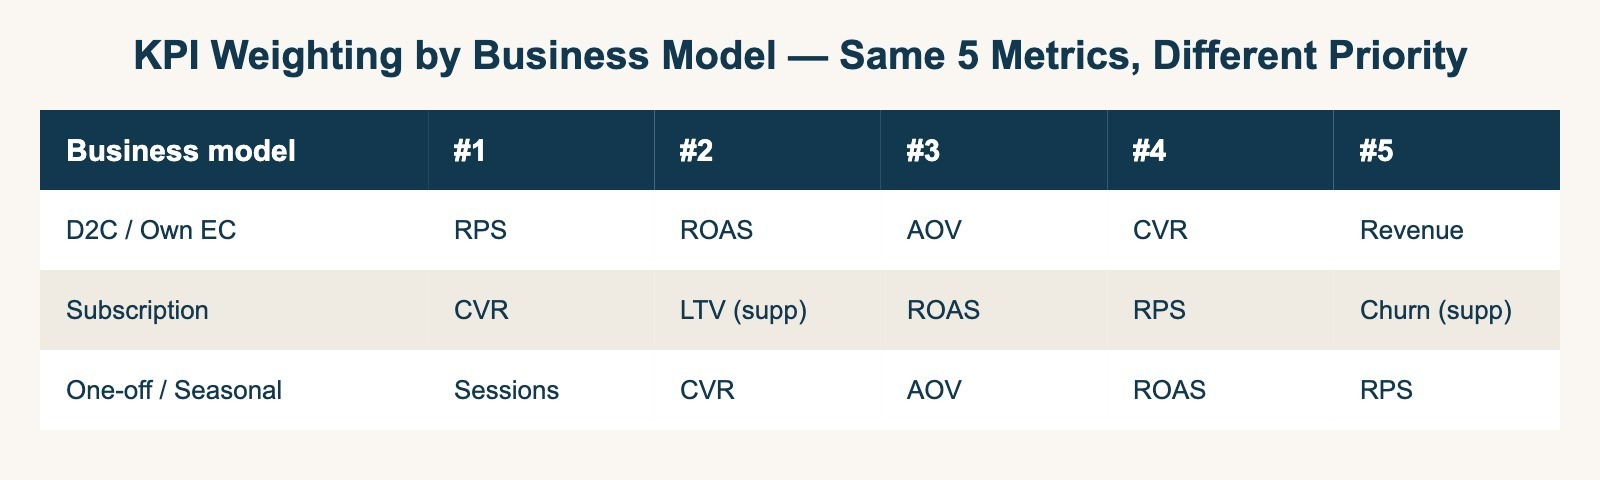
| D2C / Own EC | RPS | ROAS | AOV |
| Subscription | CVR | LTV (supp) | ROAS |
| One-off / Seasonal | Sessions | CVR | AOV |
Same 5 metrics, different priorities. Keeps the framework portable across business models without rewriting it every time.
Improvement KPIs vs health KPIs
Once you have 5 KPIs, split them again into two roles:
- Improvement KPIs (2-3): metrics you actively want to move this quarter
- Health KPIs (2-3): metrics that should hold a baseline (alerted only when out of range)
Weekly meetings discuss improvement KPIs only. Health KPIs surface when they breach a threshold. This split alone tends to halve meeting time.
Closing thought
The framework above is what I'm using right now while building RevenueScope, a thin analytics layer that surfaces these 5 KPIs by channel and campaign without reconfiguring GA4. The longer-term hypothesis: the EC teams that consistently outperform are not the ones with the most metrics — they're the ones who decided early which 5 to actually argue about every week.
How many KPIs do you review weekly? And honestly — how many of them have actually changed a decision in the last quarter?


