The "Contact Sales" button is a technical debt indicator. Every time a vendor hides their pricing behind a form, they are adding friction to your stack's scalability.
We spent months building a pipeline that tracks hundreds of SaaS pricing pages daily. But raw data is just noise. To make it actionable, we built a dashboard that treats software procurement like engineering: with logic, formulas, and daily data pipelines.
Here is the technical breakdown of the three core engines we’ve just deployed at comparedge.com.
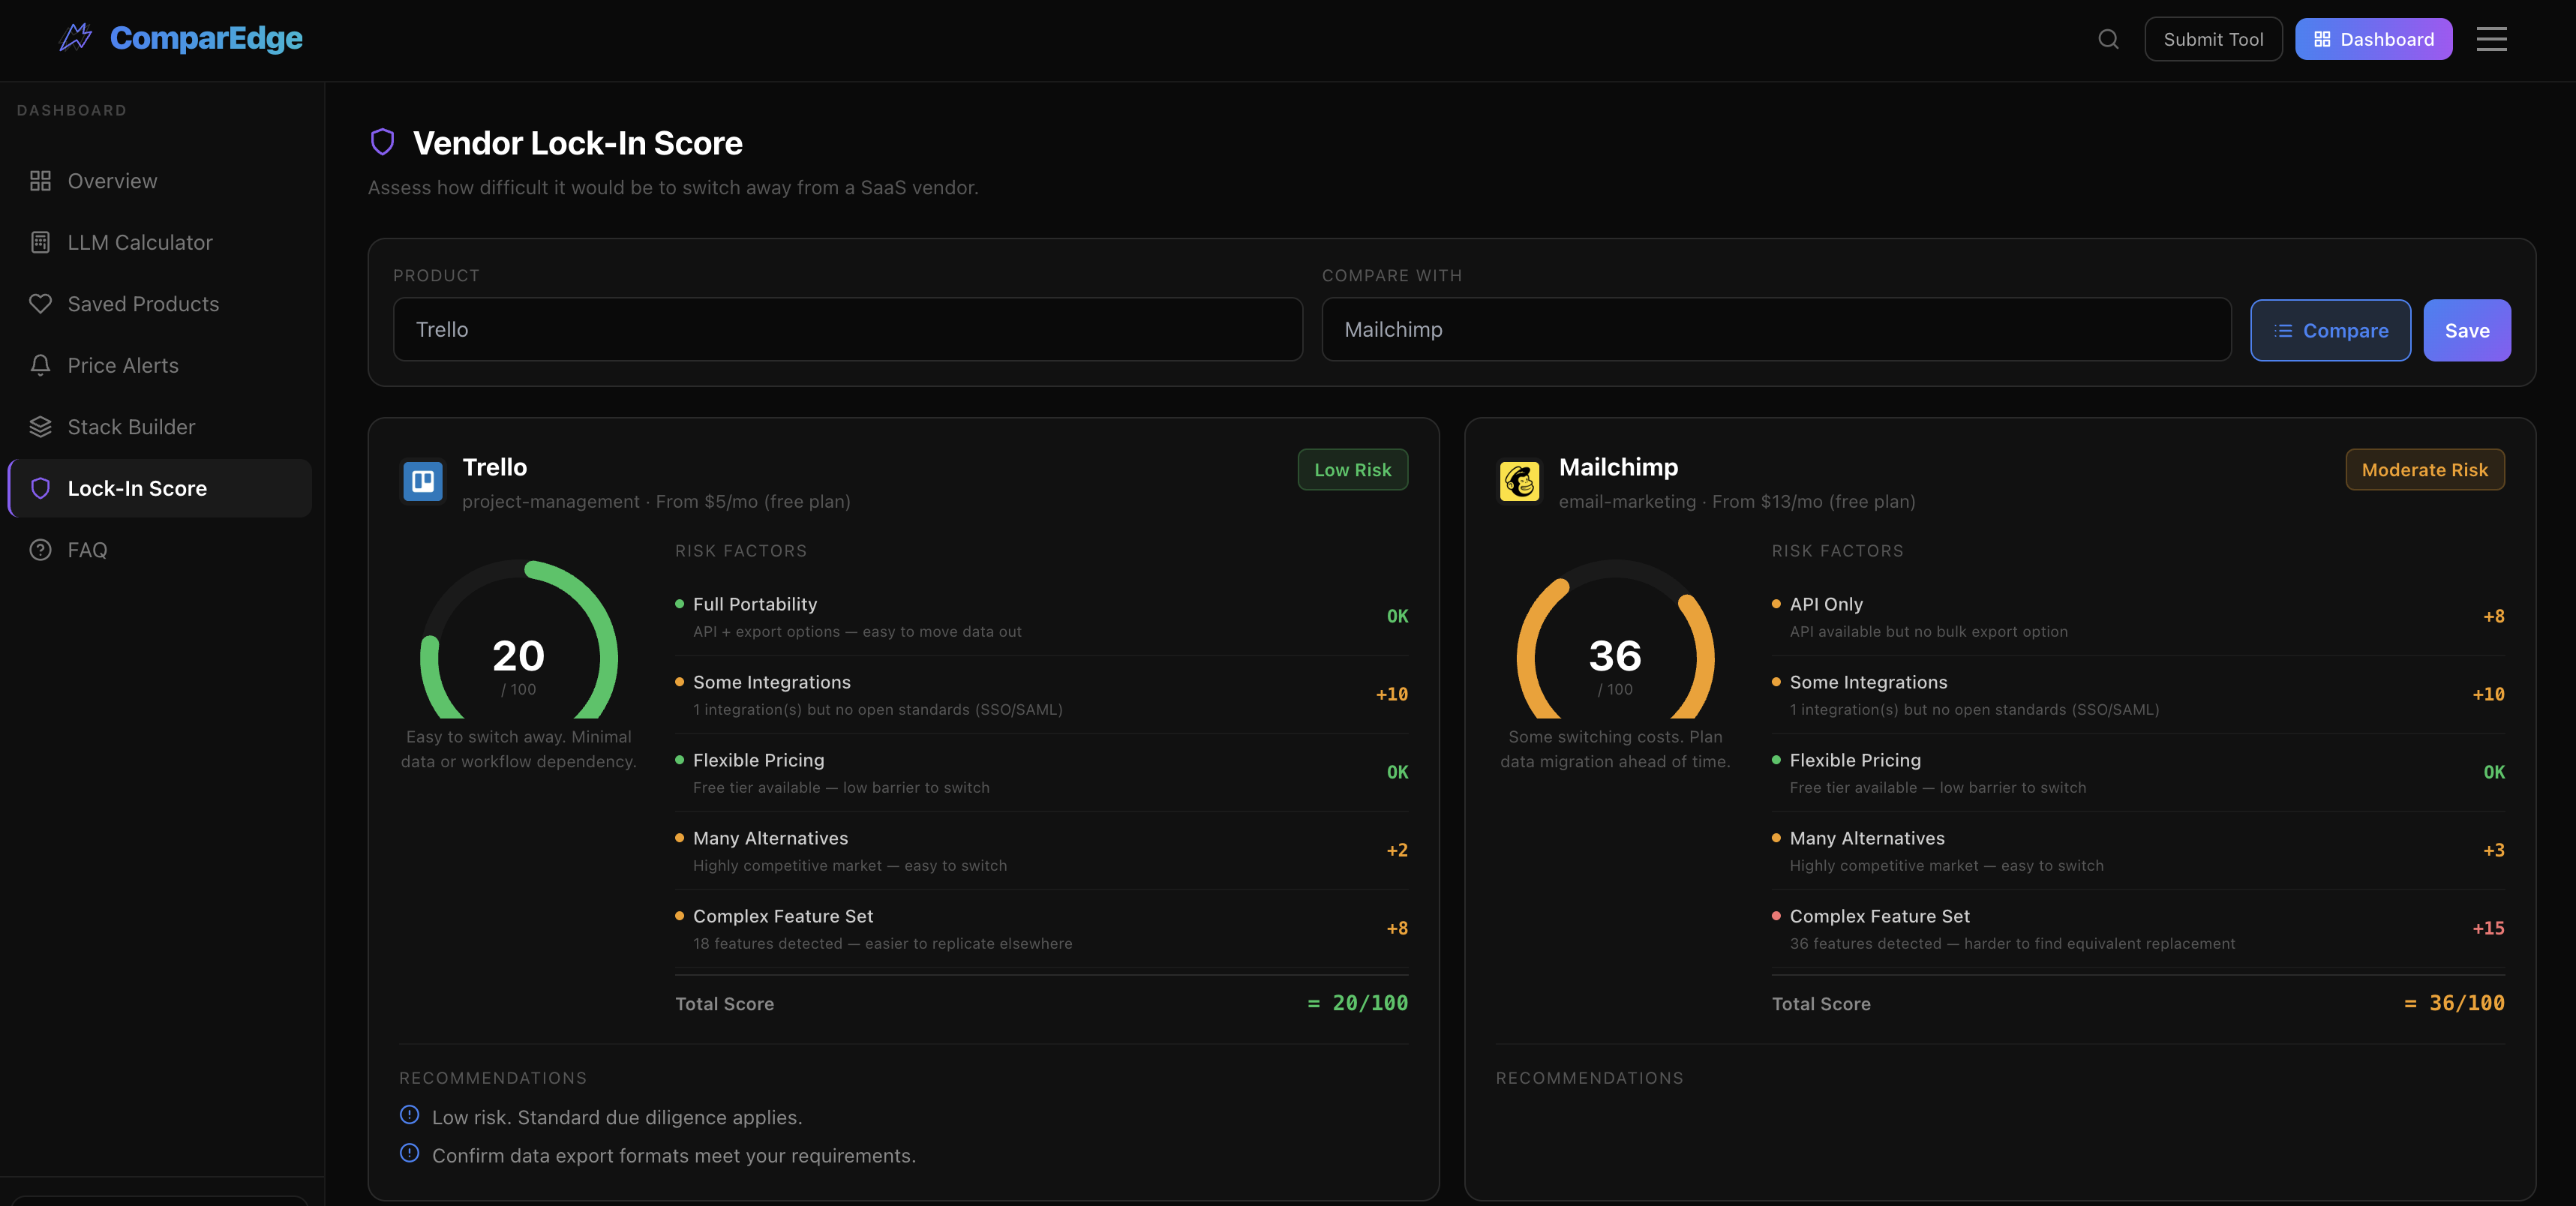
1. The Vendor Lock-In Score: Quantifying the "Exit Cost"
Most teams choose software based on features. Smart teams choose based on how hard it is to leave.
We developed the Vendor Lock-In Score to measure this. It’s not a gut feeling. It’s a weight-based matrix looking at:
- Data Portability: Does the API allow full bulk exports?
- Integration Depth: How many proprietary hooks are you forced to use?
- Contractual Friction: Auto-renewal clauses and seat minimums.
The Logic: If a tool scores an 8/10 on Lock-In, your "cheap" $50/mo starter plan is actually a high-risk liability. We’ve mapped this for hundreds of tools (on our roadmap to cross the 1,000+ mark), so you can see the trap before you step in it.
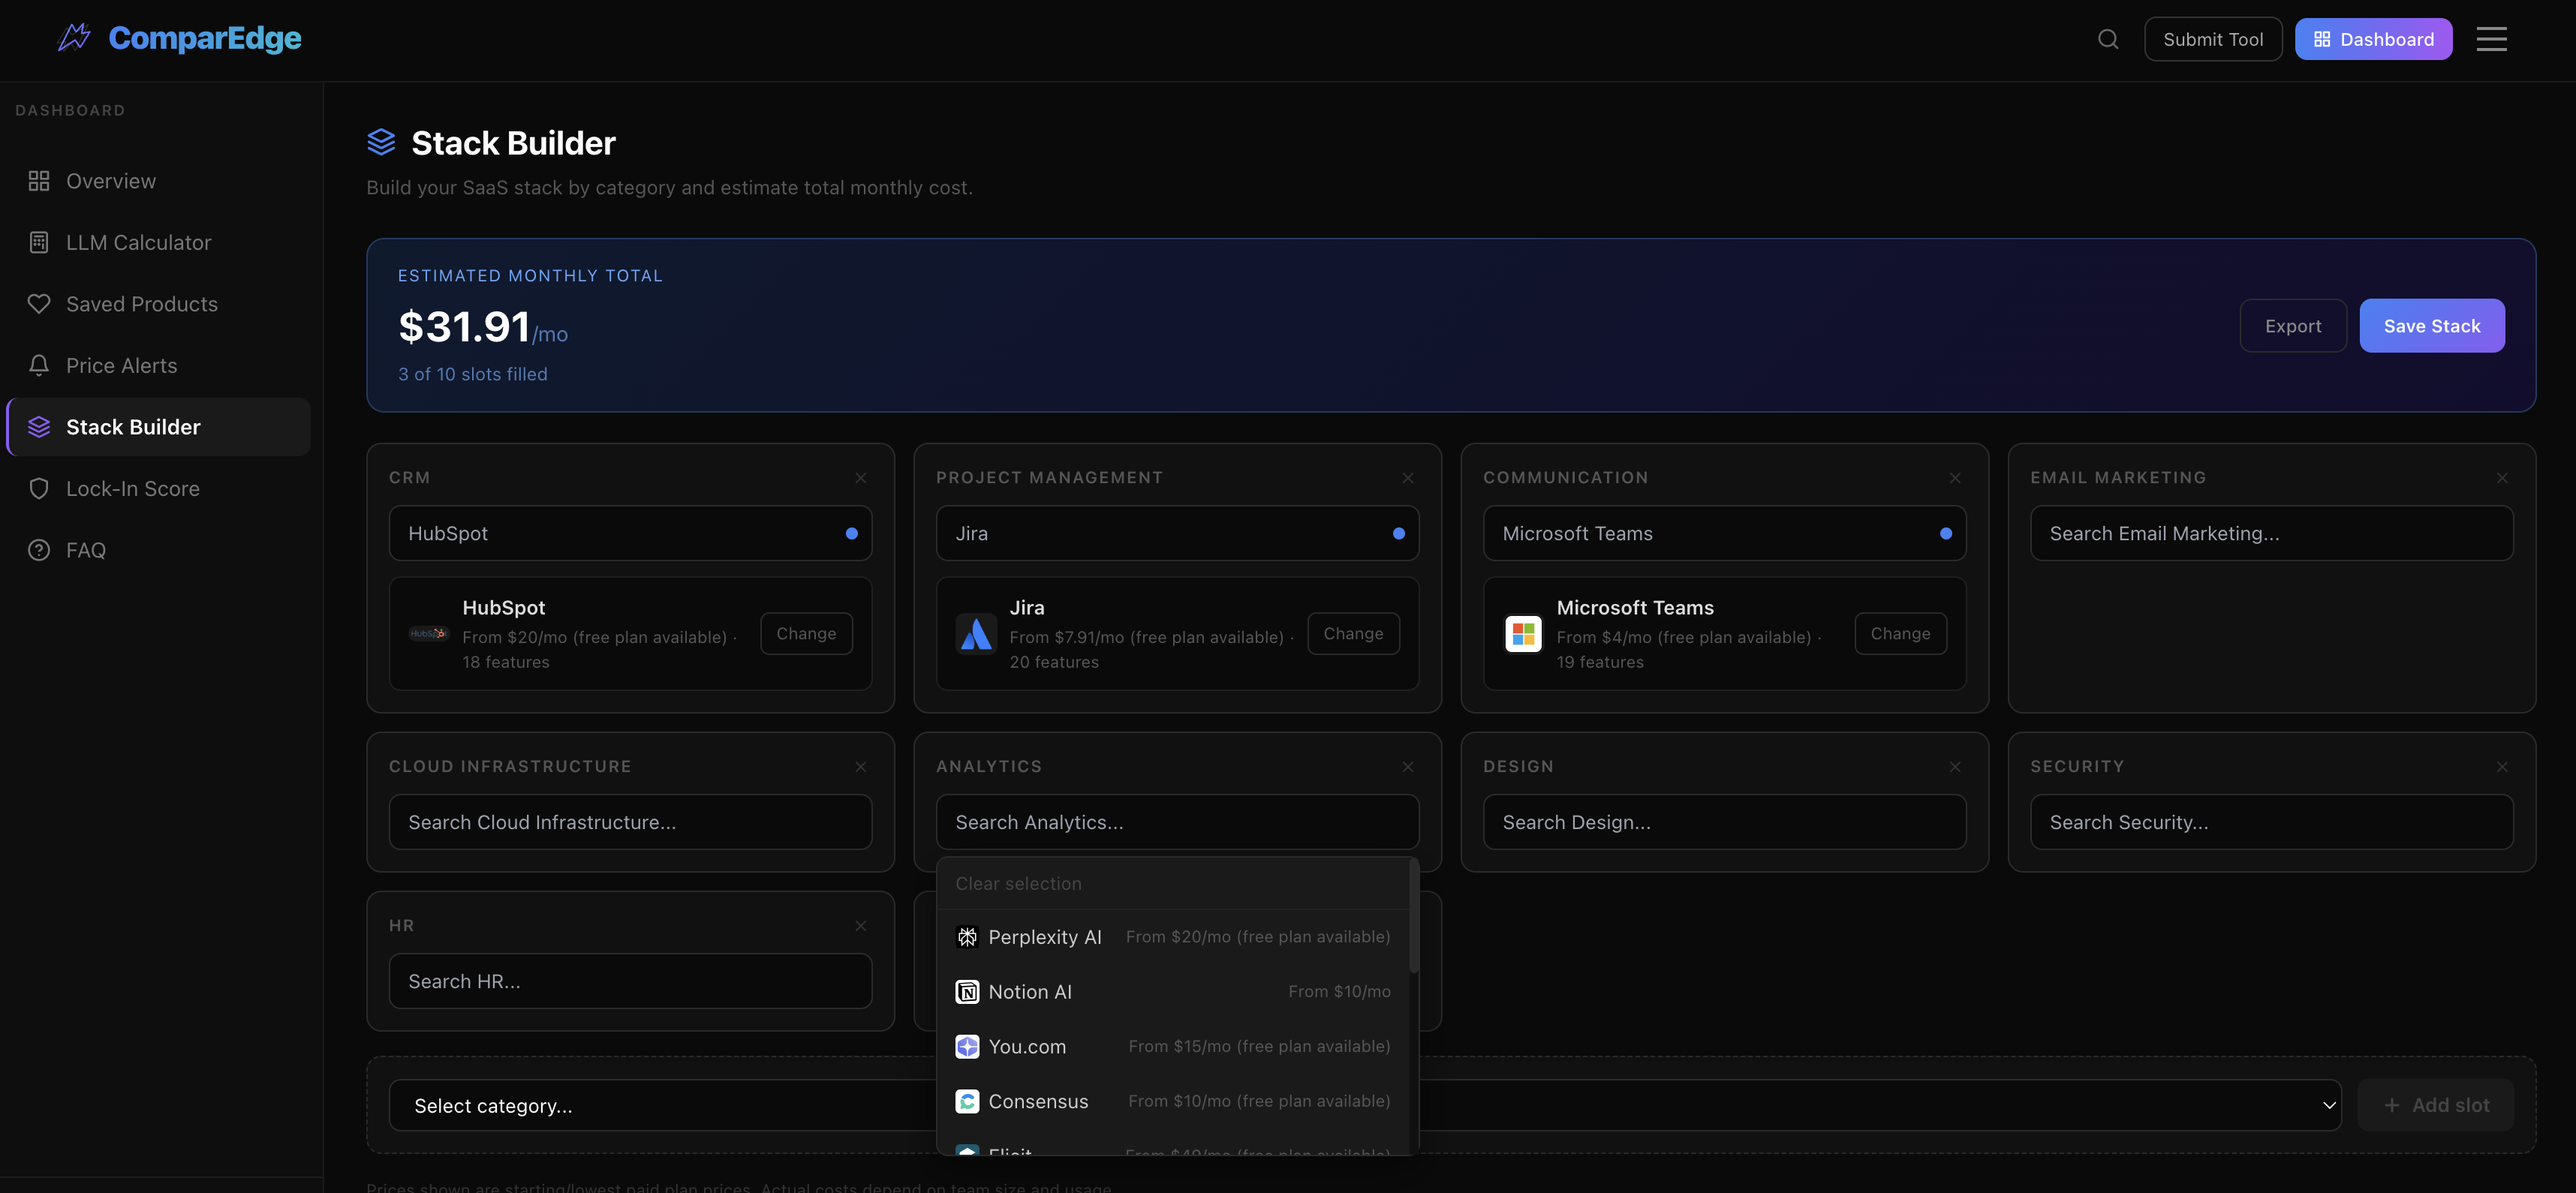
2. Stack Builder: Moving Beyond the Spreadsheet
Procurement usually happens in a messy Excel sheet. It breaks. It’s never updated.
The Stack Builder is our solution for "Infrastructure as a Budget."
- You select tools across 28+ growing categories (CRMs, Hosting, Security).
- The engine pulls daily-synced prices (no more stale data).
- It calculates the total monthly and annual burn, accounting for per-seat vs. flat-rate scaling.
It’s essentially a sandbox for your CFO. You can swap a $200/mo CRM for a $50/mo alternative and instantly see the ripple effect on your total stack cost.
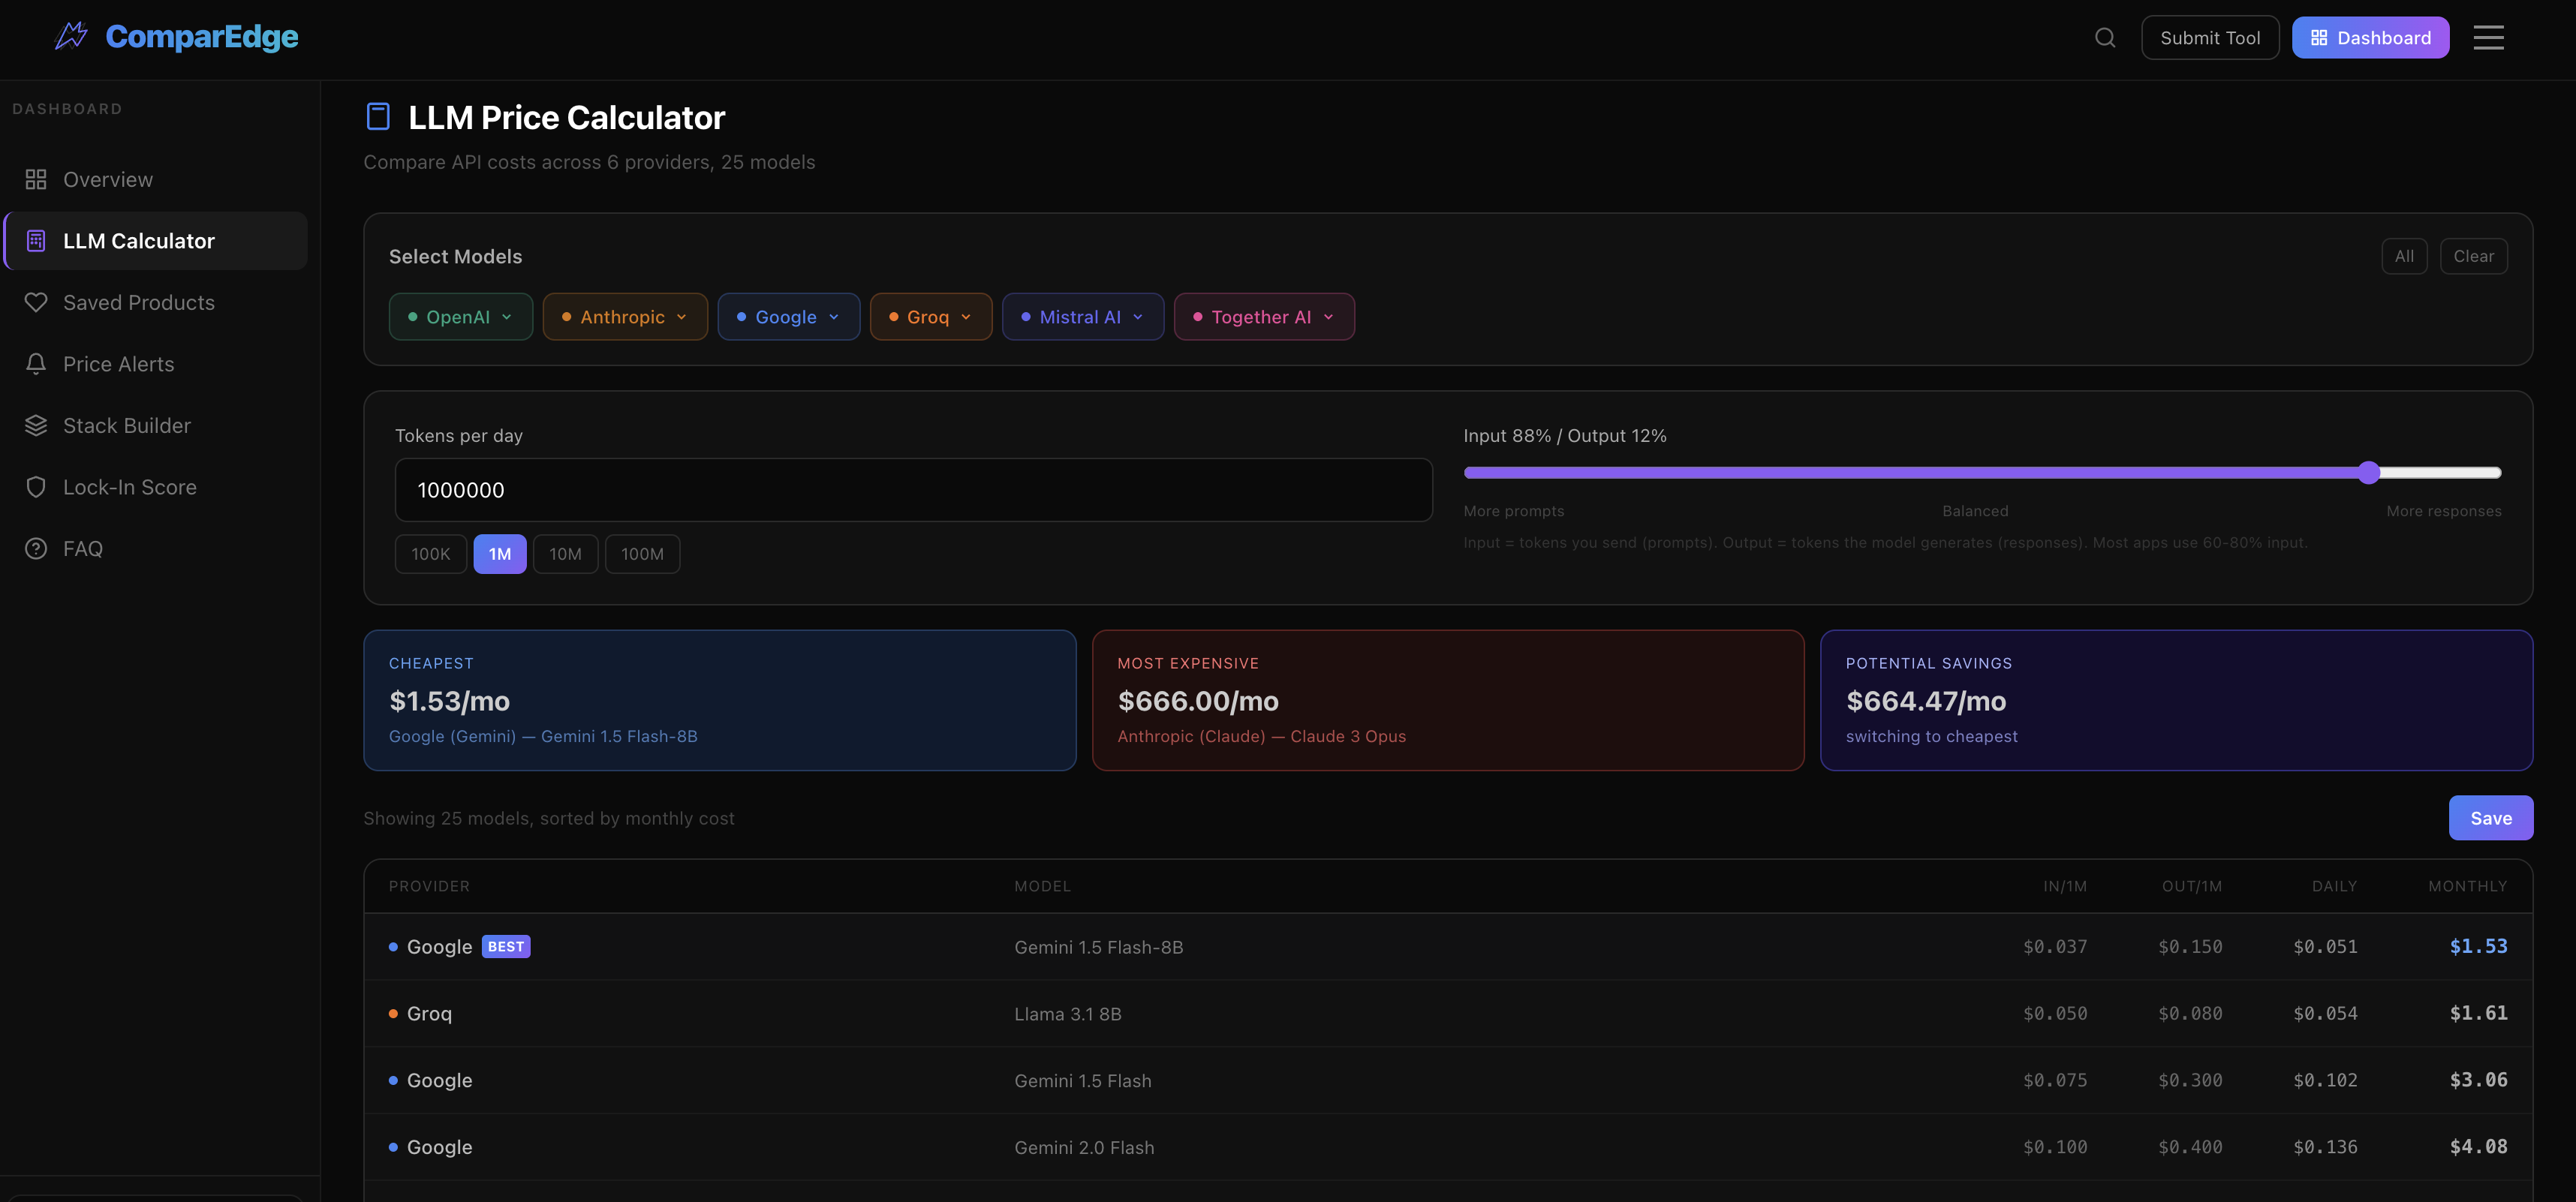
3. LLM Price Calculator: The 2026 Margin Saver
LLM pricing is a moving target. With 6 providers and 25+ models (from GPT-4o to Llama 3 on Groq), calculating token costs for a production app is a nightmare.
Our LLM Calculator normalizes this. Input your expected monthly tokens (Input/Output), and it spits out a side-by-side comparison.
- Why it matters: We found that switching providers for the same model can save up to 40% in margins.
- Data Freshness: Since we sync daily, we catch those "stealth" price drops the moment they hit the docs.
The Infrastructure of Transparency
Everything we do is Open Data.
- GitHub: Fork the logic.
- Kaggle: Use the raw SQLite/CSV dumps for your own models.
- Railway API: Hit our public end-points (no auth required) to pipe these prices directly into your internal tools.
We are building a public utility. Software is the biggest line item for modern companies after payroll. It shouldn't be a black box.
Try the dashboard: comparedge.com/dashboard Code & Data: comparedge.com/open-data
No "Contact Sales" buttons were harmed in the making of this project.